Resting-ECG analytic: master's thesis project
Contents
This project was a part of my Master's thesis. Here I built a prototype analytical tool that can:
- Explore the data
- Explore individual variables to check normality by producing a histogram, boxplot, Q-Q plot, density plot, and Shapiro-Wilk normality test. There is an option to transform the variable to square root and log10.
- Perform a correlation summary between all the variables which can be filtered by correlation strength.
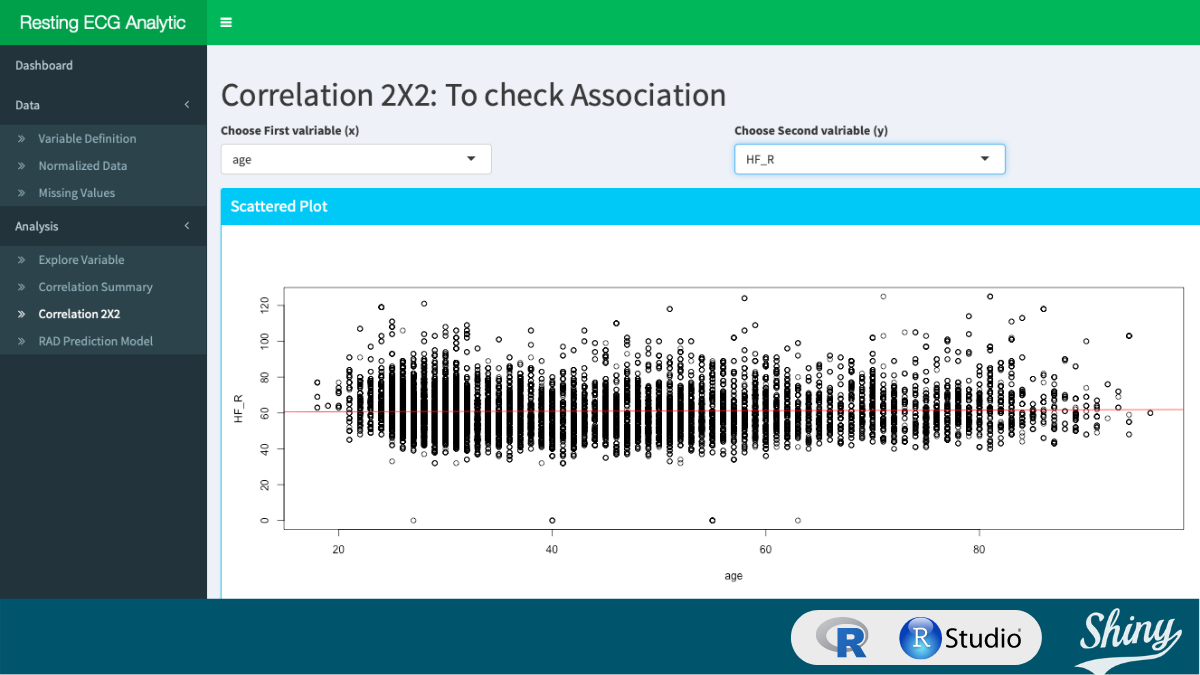
- Perform a 2x2 correlation between 2 variables (that can be chosen) by scattered plot and 3 tests namely Person, Kendall, and Spearman.
- Explore the RAD (Right Axis Deviation) model to see the coefficients, confusion matrix, model accuracy, sensitivity, and specificity. Predictor variables and also be chosen to see the model behavior.
Technology Used
- Language: R, SQL
- IDE: R-Studio
- Database: H2
R package used
- RH2 - DBI/RJDBC Interface to H2 Database
- rJava - Low-Level R to Java Interface
- lubridate - Functions to work with date-times and time-spans: fast and user-friendly parsing of date-time data, extraction, and updating of components of a date-time (years, months, days, hours, minutes, and seconds), algebraic manipulation on date-time and time-span objects.
- dplyr - A fast, consistent tool for working with data frame-like objects, both in memory and out of memory.
- tidyr - It's designed specifically for data tidying (not general reshaping or aggregating) and works well with 'dplyr' data pipelines.
- Hmisc - Contains many functions useful for data analysis, high-level graphics, utility operations, functions for computing sample size and power, importing and annotating datasets, imputing missing values, etc.
- Shiny - Makes it incredibly easy to build interactive web applications with R. Automatic “reactive” binding between inputs and outputs and extensive prebuilt widgets make it possible to build beautiful, responsive, and powerful applications with minimal effort.
- Shinydashboard - Create dashboards with 'Shiny'. This package provides a theme on top of 'Shiny', making it easy to create attractive dashboards.
- Shinycssloader - Add CSS Loading Animations to 'shiny' Outputs.
Ggplot2 - A data visualization package for the statistical programming language R.
What I did
a-z
More about my master's thesis: click here
Video Demonstration


Member discussion